
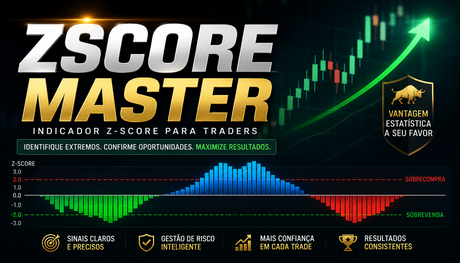
Z-Score indicator — With BUY and SELL point markers. Measures, in standard deviations, how far the closing price has moved from its reference moving average (Hull MA). Formula: Z = (Close - Hull Average) / Standard Deviation. A Z of +2 means two deviations above the average; -2 means two below. Quick reading: the zero line represents balance (price at its average). Green (Z>0) indicates price above the average; red (Z<0) indicates price below it. The further from zero, the more extended the price. Crossing zero marks a change in short-term bias. Reference bands: 0 to 1 = normal; 1 to 2 = extended, pay attention; 2 to 3 = overextended, high probability of mean reversion; above 3 = extreme. Trading use (mean reversion): the trigger is not the extreme itself, but when Z touches ±2/±3 and the histogram begins to contract toward zero. This signals that the extension is running out and price tends to return to the mean. Confirm with volume and structure: a genuine reversal comes with participation; be cautious when volume is weak. Where it fails: this is a reversal tool, best suited to ranging markets and intraday sessions that have already settled. In a strong trend, Z may remain at an extreme while price keeps moving. Do not use it alone to trade against the trend during those stretches. It is better to assess it after the opening volatility subsides. A standard Z-Score does not predict direction: it measures distance. It is a context and confirmation indicator, whereas ZSCORE MASTER also displays BUY and SELL points. Use the indicator together with Technical Zones to trade with greater peace of mind.
ZSCORE MASTER
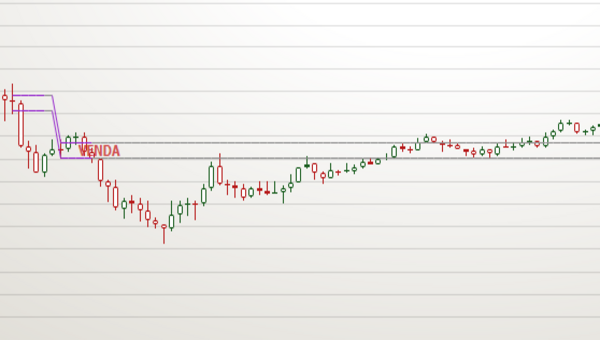
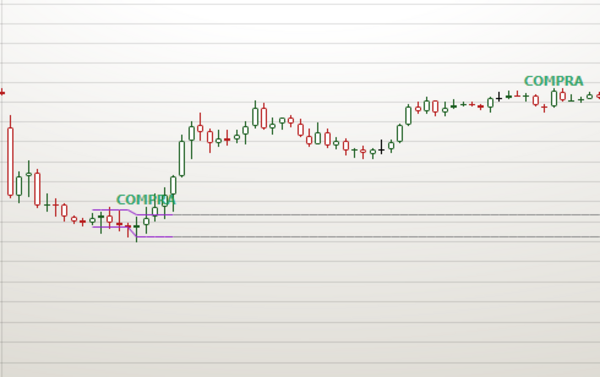
Combining Technical Level zones with BUY and SELL markers produces highly accurate results.