
Tendência Vendedora was developed to help traders identify moments when a downtrend has a higher probability of continuing. The indicator analyzes several important market factors, including the main trend, price structure, financial volume and institutional behavior. When all criteria are confirmed, the message "Tendência Venda" appears on the chart, indicating a possible selling opportunity. How to interpret the signal: When the alert appears, it means: The market is already in a downtrend. Price has pulled back to an important resistance zone. The attempt to rise has been rejected. Financial volume has increased again in favor of sellers. Selling pressure has shown enough strength to continue the move. In other words, the indicator seeks to identify when the market has already shown clear signs of intending to keep falling, avoiding premature trades or trades based only on assumptions. How to use it in practice: Open the chart and wait for the message "Tendência Venda". Use the signal as confirmation when looking for selling opportunities. Avoid trading against the direction indicated by the market. Always apply appropriate risk management. Prioritize trades aligned with the prevailing trend.
TENDÊNCIA VENDEDORA

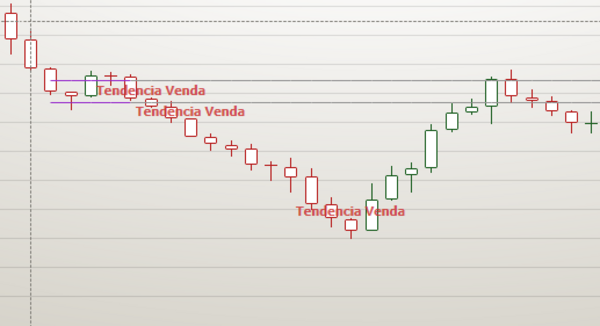
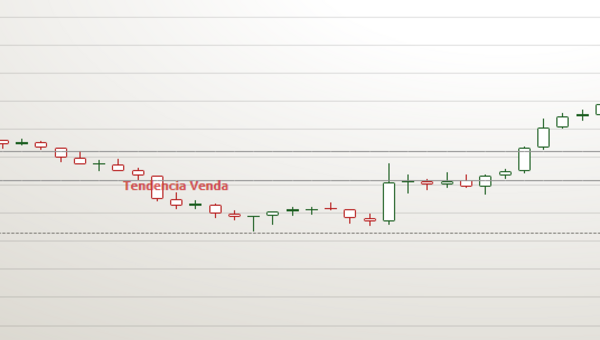
Even when the indicator provides a signal, it is important to use it when price breaks a technical level zone or is very close to it.