
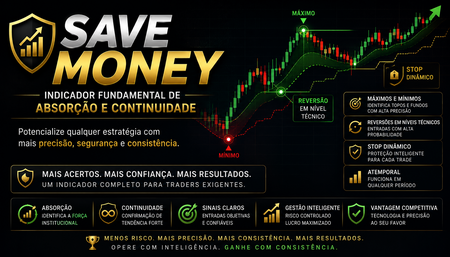
SaveMoney indicator — How to interpret it Interprets Wyckoff principles through colored bars showing market conditions and works across different timeframes (1, 5 and 15 minutes). Used on WIN, USA500, NIKKEI and other indices; for low-volume instruments, it works better above the 1-minute timeframe. Use it in a separate panel below the price chart. The upper and lower limits are already calibrated (continuation range between 0.6 and 1) and can be adjusted through the input parameters. Without an open position: – Green (between the limits): continuation. A calmer environment for applying your strategy. – Yellow (above the limit): possible absorption developing. Wait. – Red (above the limit): absorption alert. This may be a pause in the trend or a reversal. – Yellow/red (below the lower limit): movement without supporting volume or displacement. An undefined zone. With an open position: – Yellow/red: exhaustion of the move, whether upward or downward. A good time to consider taking profits. – The same zone acts as a dynamic stop: it helps avoid a premature exit, as the move often turns back in your favor after passing through it. SaveMoney is a context and confirmation tool that supports your own decisions based on the technical levels suggested by InstitucionalBay.
SAVE MONEY
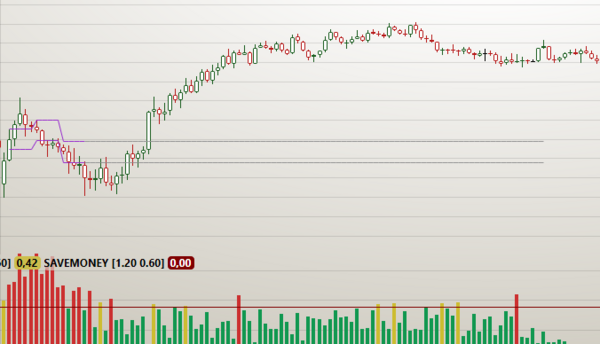
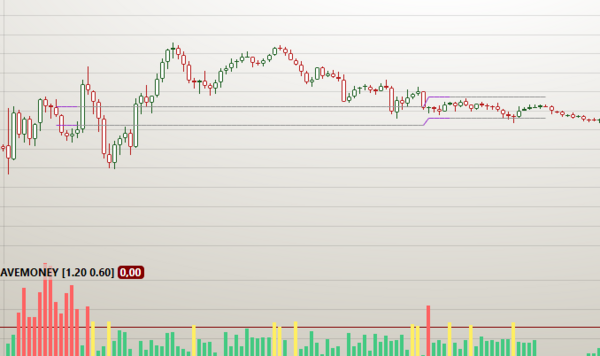
Green bars indicate continuation. Watch closely when price breaks the institutional zone boundaries to trade with greater peace of mind.