
How to use the indicator (best performance: 5 minutes) Displays two signals on the chart: • BUY, in green: price has broken the low of the last 4 candles and closed back above it. This is a false decline that has trapped sellers and may signal an upward reversal. • SELL, in red: price has broken the high of the last 4 candles and closed back below it. This is a false rise that has trapped buyers and may signal a downward reversal. A signal appears only when three conditions align: the Wyckoff pattern (a false breakout that fails and reverses), volume confirmation (above-average volume and genuine absorption in the previous candle) and a favorable position relative to VWAP, with room to move. It does not mark every reversal, but those showing institutional participation. How to trade: this is a decision tool, not a robot. For a green signal, assess a buy; for a red signal, assess a sell. Use the extreme of the signal candle — the low of the green candle or the high of the red candle — as a stop reference. You define the target and position size according to your risk management. Where it works best: liquid instruments and periods of greater order flow, especially when the signal coincides with a technical absorption level. Works on futures, stocks and cryptocurrencies. Important: the indicator tells you WHERE to watch for entries. The final decision — whether to enter, exit and how much to risk — is yours. Always trade with risk management.
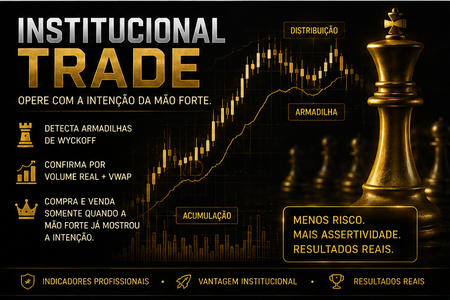
INSTITUCIONAL TRADE
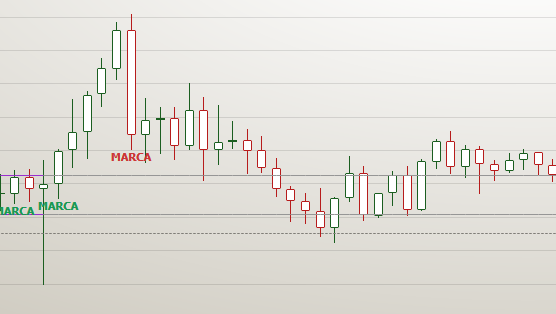
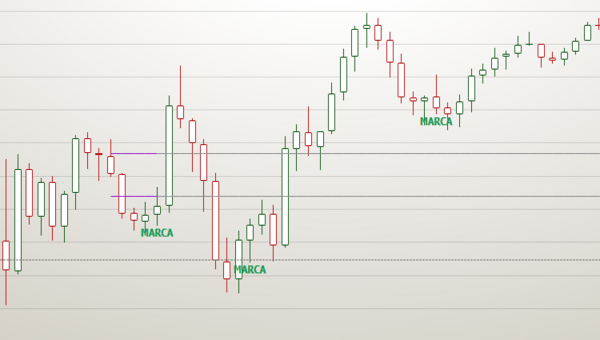
This indicator stands out for the institutional precision of its buy and sell markers.