
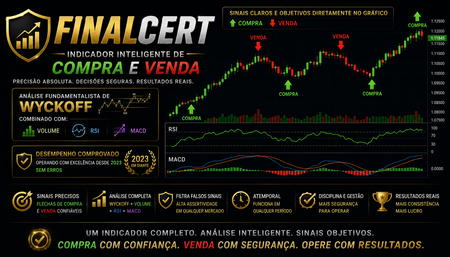
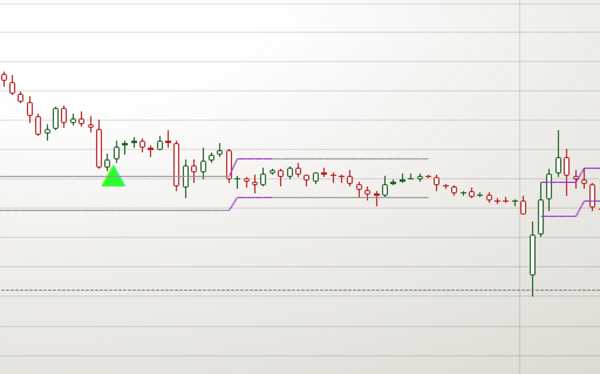
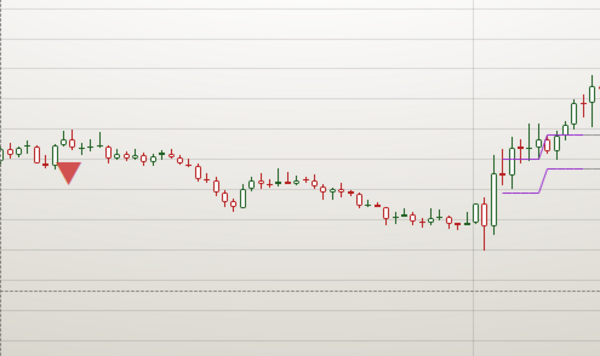
Entry indicator, easy to see and use — How to interpret it Marks reversal entry points based on Wyckoff. Instead of signaling every breakout, it waits for the classic trap and signals only once it is confirmed. This makes it selective, with relatively few signals. What it looks for: – Buy (Spring): price breaks a previous low but closes back above it and above the previous close; the downward breakout has failed. The green arrow appears when there is also exhaustion (lower volume than the previous signal), a low RSI and momentum divergence. – Sell (Upthrust/UTAD): price breaks a previous high but closes back below it; the upward breakout has failed. The red arrow uses the same logic in reverse: declining volume, a high RSI and divergence. Filters that provide selectivity: – Volume quality (relative VDI): validates signals only when volume is in the continuation range or at a genuine spike. – Minimum spacing between markers and a daily reset to avoid repeating signals within the same move. – A trading window ending at 16:00 to avoid the end of the session. How to use it: the arrow marks the location and direction of a higher-conviction entry. Validate it against the context (structure, VWAP and trend) and manage the exit using your targets. This is a selective entry and confirmation trigger, not a complete automated system. Best performance on 5-minute charts.
FINAL CERT
Always aim to make trading decisions outside absorption areas or Technical Level zones.